This is a part of the vehicle monthly report and battery monthly report in December. I will extract some for your reference. Today’s content is mainly to give you some ideas from the geographical latitude, look at the penetration rate of different provinces, and discuss the depth of China’s new energy vehicle penetration rate by price segment and positioning.
The information in the table below mainly includes the total market volume in November, and the penetration rates of gasoline vehicles, HEVs, PHEVs and BEVs.

▲Figure 1. The penetration rate of passenger vehicles in China in November
If we make a pie chart of the total amount in geographic latitude, we can visualize the penetration rate. This picture shows China’s current car sales (circle size) and the distribution of different types. I painted pure electric cars in green , the plug-in hybrid is painted blue, and the yellow part is the gasoline car.
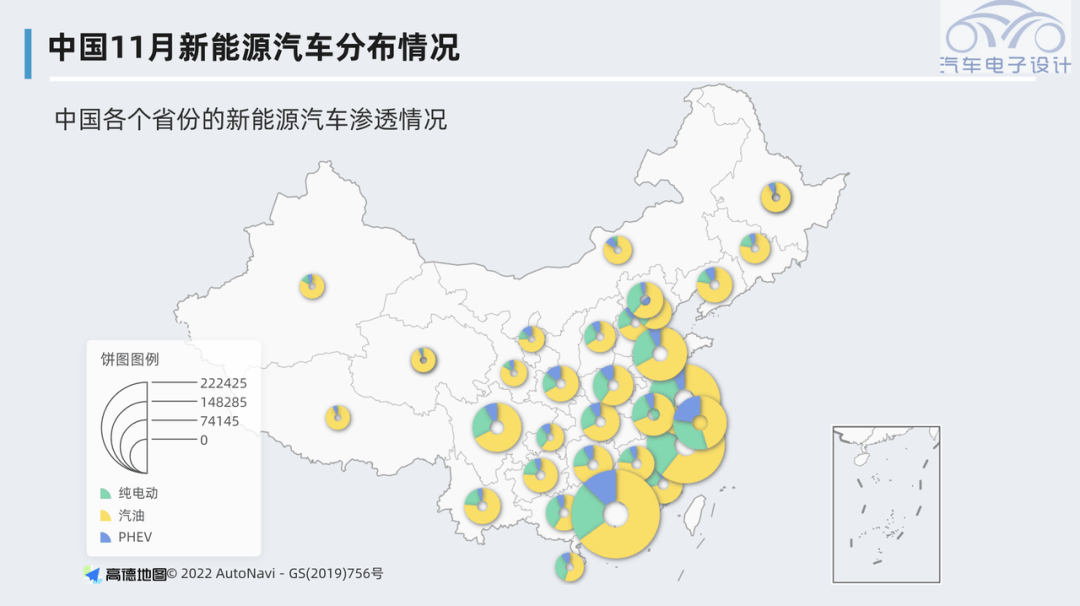
▲Figure 2. Permeability by region
Part 1
Sub-price segment and classification
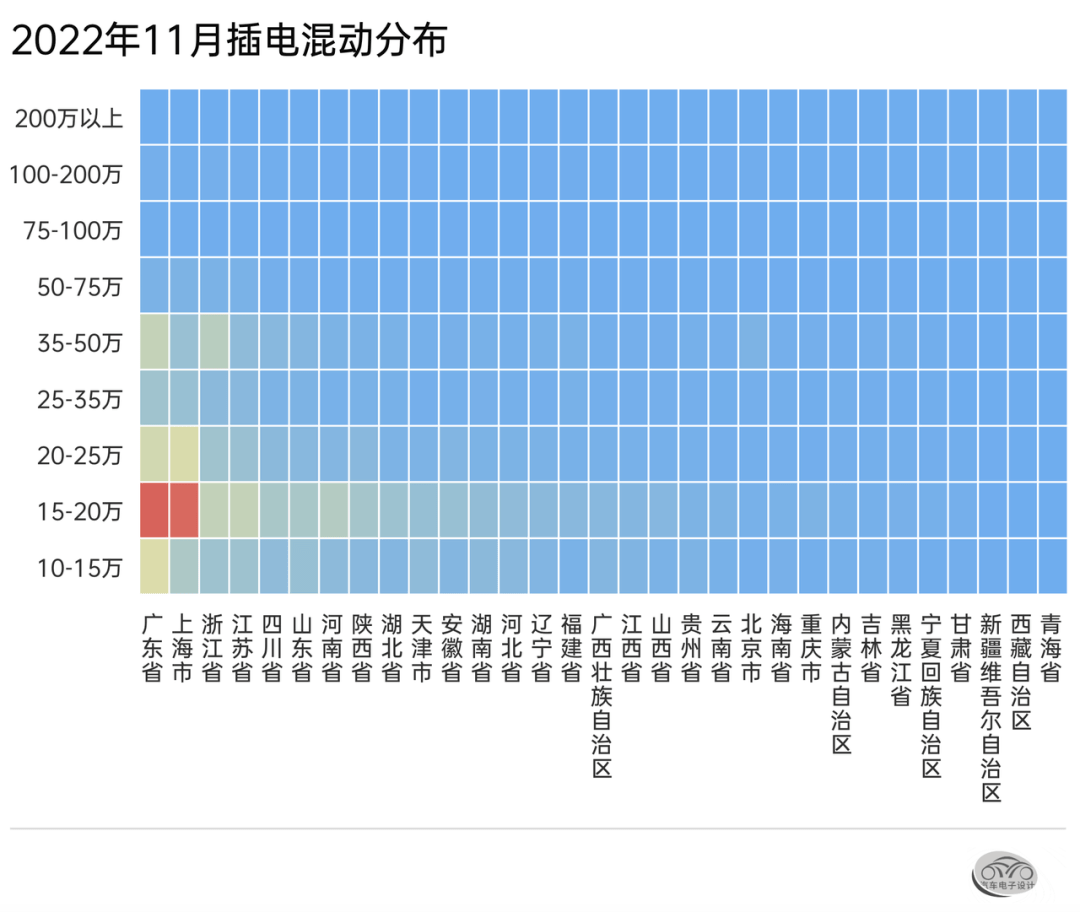
In order to let everyone better understand the situation of penetration, I used a Cartesian heat map. After listing BEV and PHEV, you can see the following pictures.
● Pure electric
Judging from the monthly data, several affluent provinces are currently the basic market for Tesla and new forces, mainly including Zhejiang, Guangdong, Acceleration and Shanghai. At the same time, customers in these areas also have an obvious demand for 100,000 to 150,000 yuan. Of course, this has a lot to do with the overall climate suitable for electric vehicles.
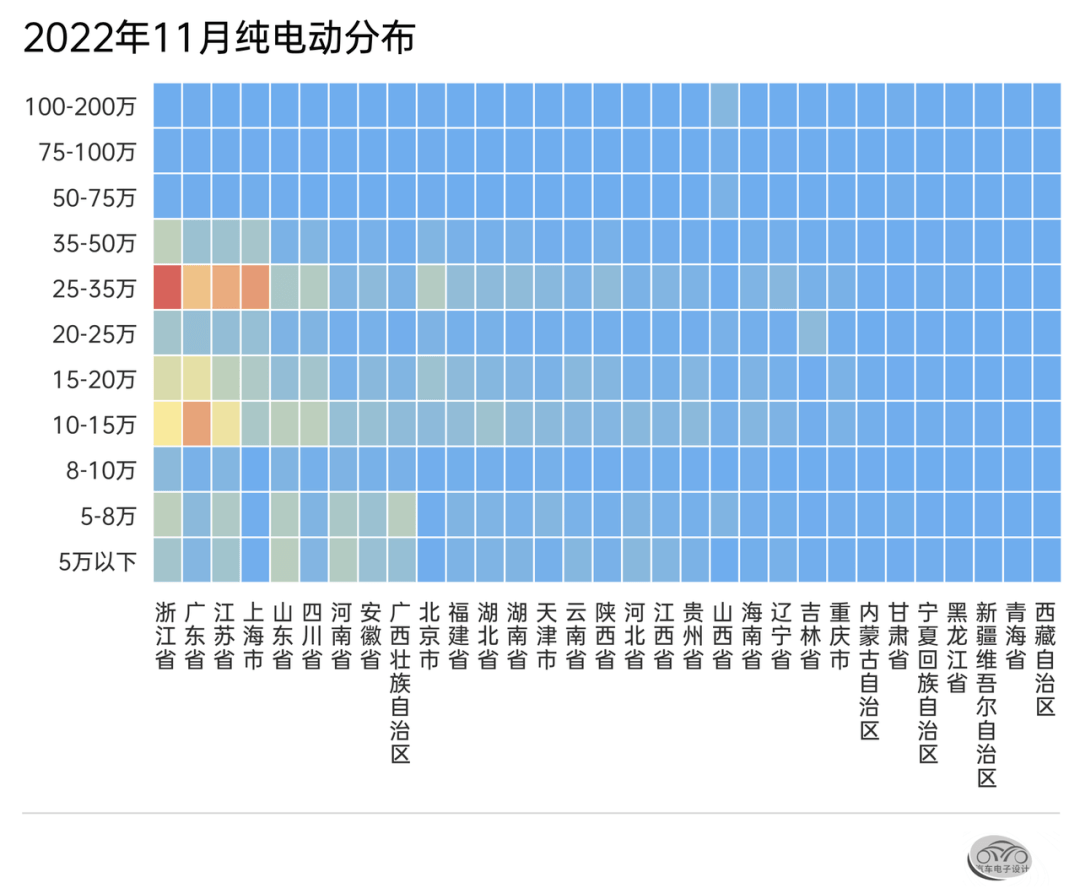
▲ Figure 3. Distribution of pure electric vehicles by province and price segment
Corresponding to the price is the positioning. After subdividing different models, we can see the situation of models corresponding to different price segments. This data still allows us to see the actual status of the current models more clearly.
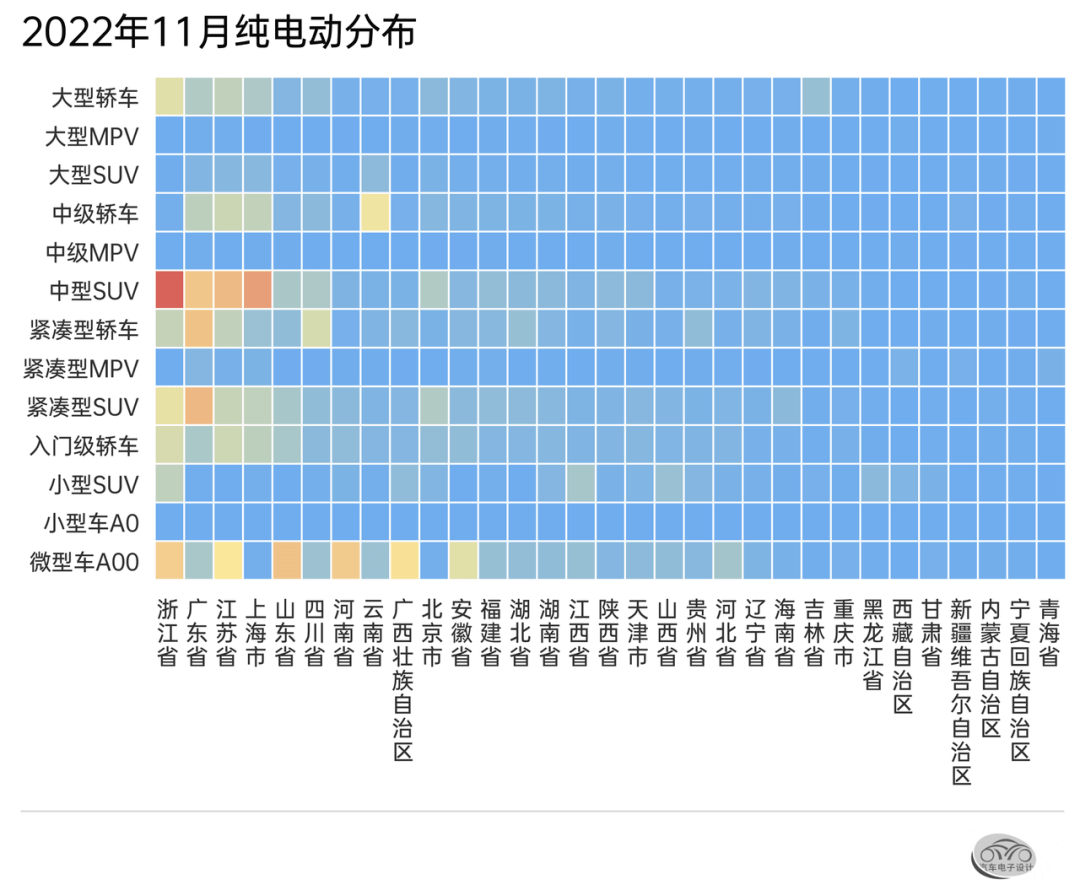
▲ Figure 4. Model map of pure electric vehicles
From these two figures, the current state of pure electric vehicles can still be seen. The main demand revolves around medium-sized SUVs, compact SUVs and miniature A00 vehicles. If we make a distribution of the top 10 models
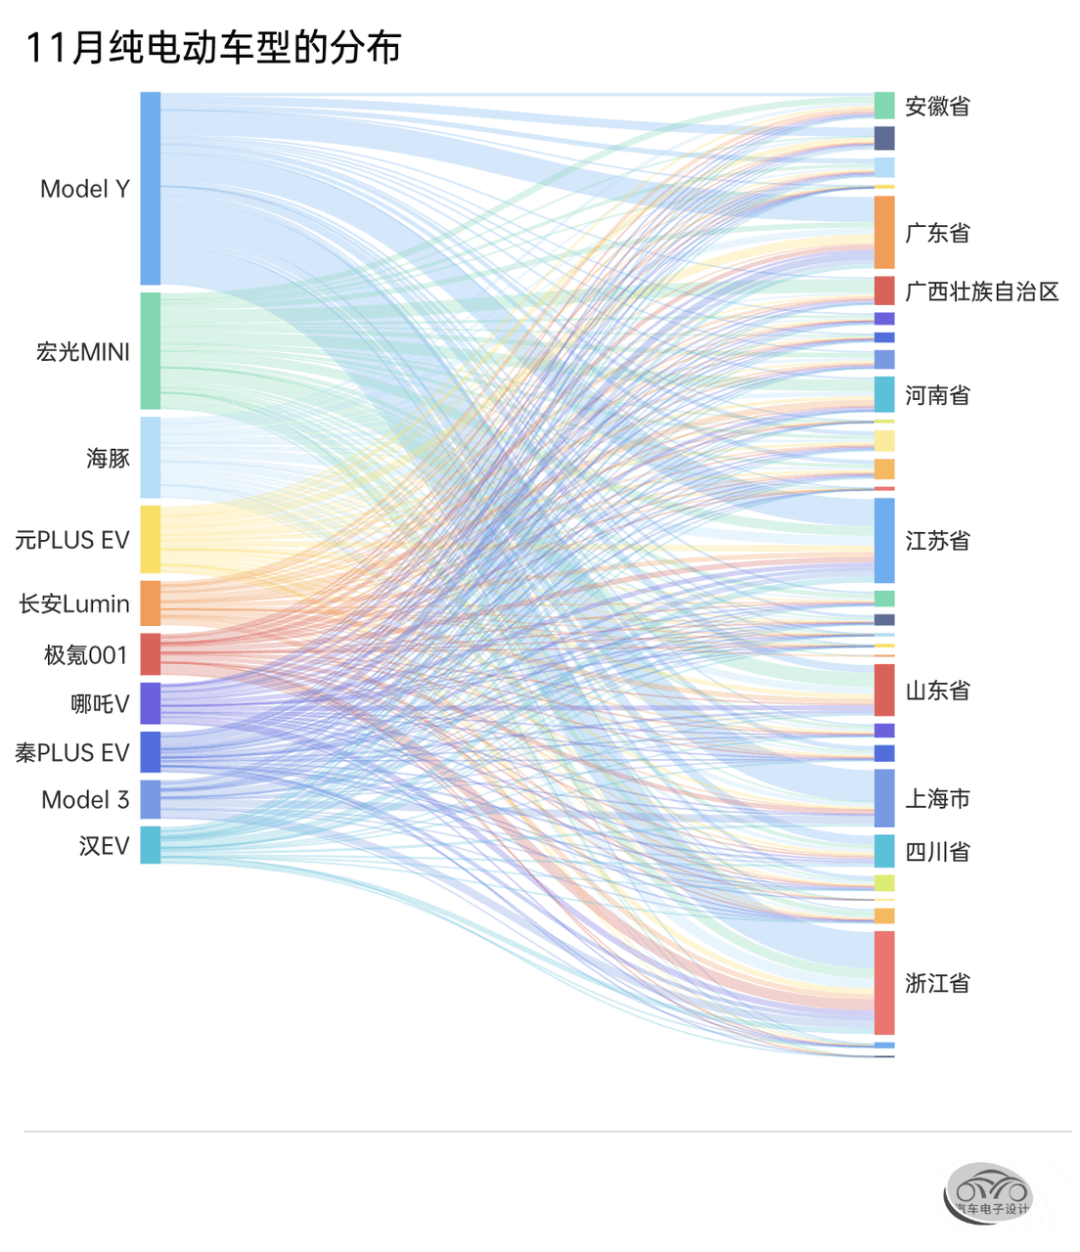
▲ Figure 5. The top 10 pure electric vehicles by region
● Plug-in hybrid
Since the license plates in Shanghai will be delivered in December 2022, the recent delivery of PHEVs is rushing to this time node, and the situation in Guangdong may be similar. No one knows whether the cities that have given out license plates will continue to give them away after the start of 2023. It is different from what we imagined. Currently, plug-in hybrids are being delivered in a concentrated manner, especially concentrated.
▲ Figure 6. Continuous delivery of plug-in hybrids in 2022
The following distribution according to the top 10 models is more able to reflect the problem.
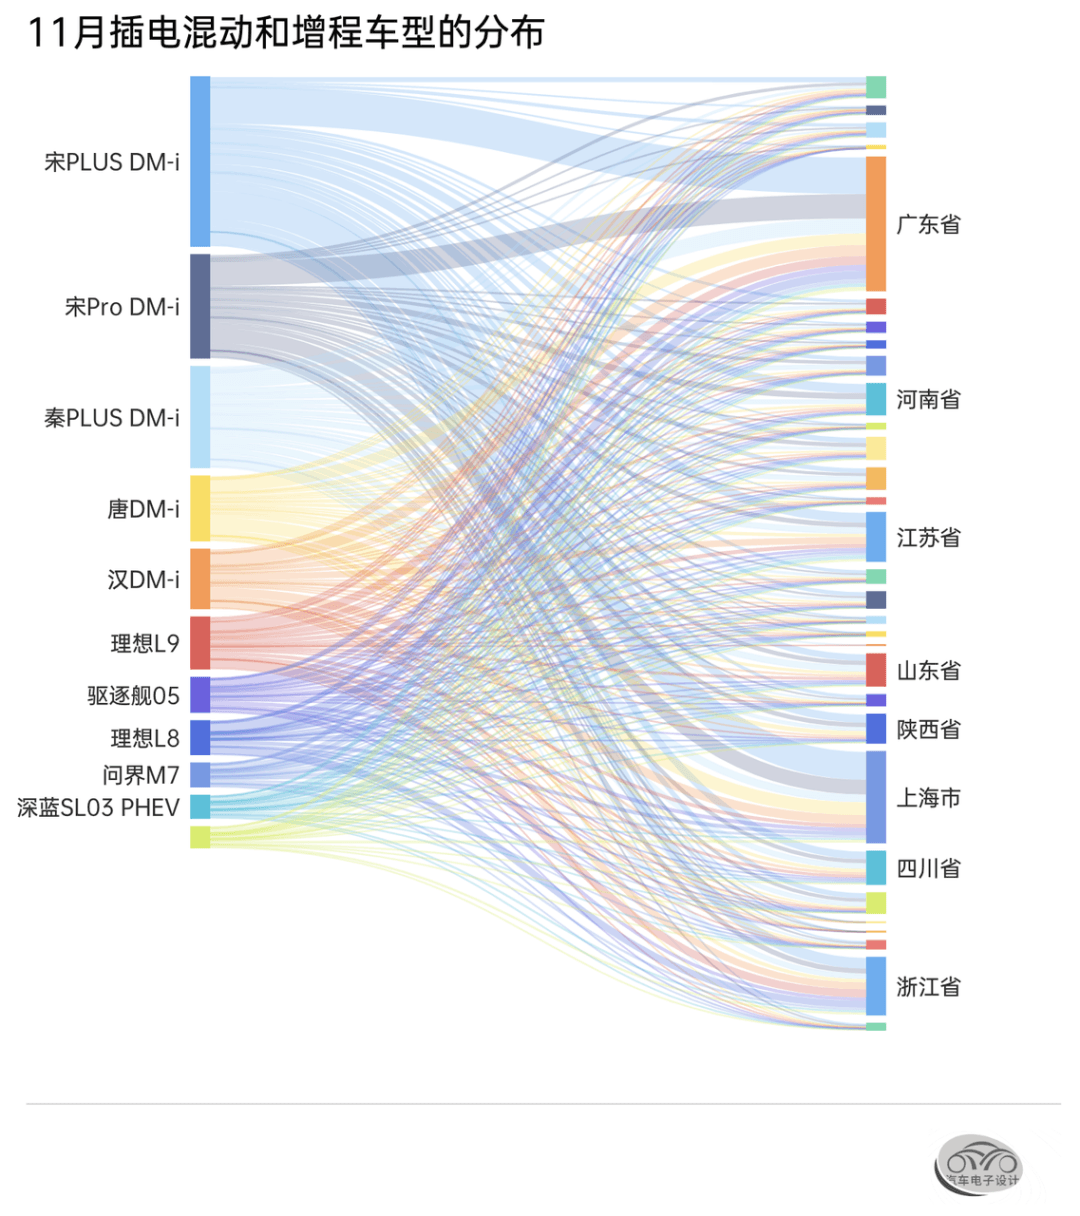
▲ Figure 7. Distribution of plug-in hybrid and extended range
Information mining about geographic latitude can also be done around cities. I am trying to see some changes based on different visualization effects. Putting together the changes in different months and different time periods, we can see something.
Part 2
battery part
● Power battery output
November is the peak of production. Judging from this momentum, there is a high probability of growth in December, which is also a short-term high point. Since January is the Spring Festival, and there are many uncertainties, the current production volume may be used in Q1 of 2023 in the future.
In November, my country’s power battery output totaled 63.4GWh, a year-on-year increase of 124.6%, and a chain increase of 0.9%. Among them, the output of ternary batteries was 24.2GWh, accounting for 38%, a year-on-year increase of 133.0%, and a decrease of 0.2%. The output of lithium iron phosphate batteries was 39.1GWh, accounting for 62%, a year-on-year increase of 119.7%, and a chain increase of 1.4%;
From January to November, the cumulative output of power batteries in my country was 489.2GWh, a cumulative increase of 160%. Among them, the cumulative output of ternary batteries was 190.0GWh, accounting for 38.8%, a cumulative increase of 131%. The cumulative output of lithium iron phosphate batteries was 298.5GWh, accounting for 61.%, a cumulative increase of 183%.
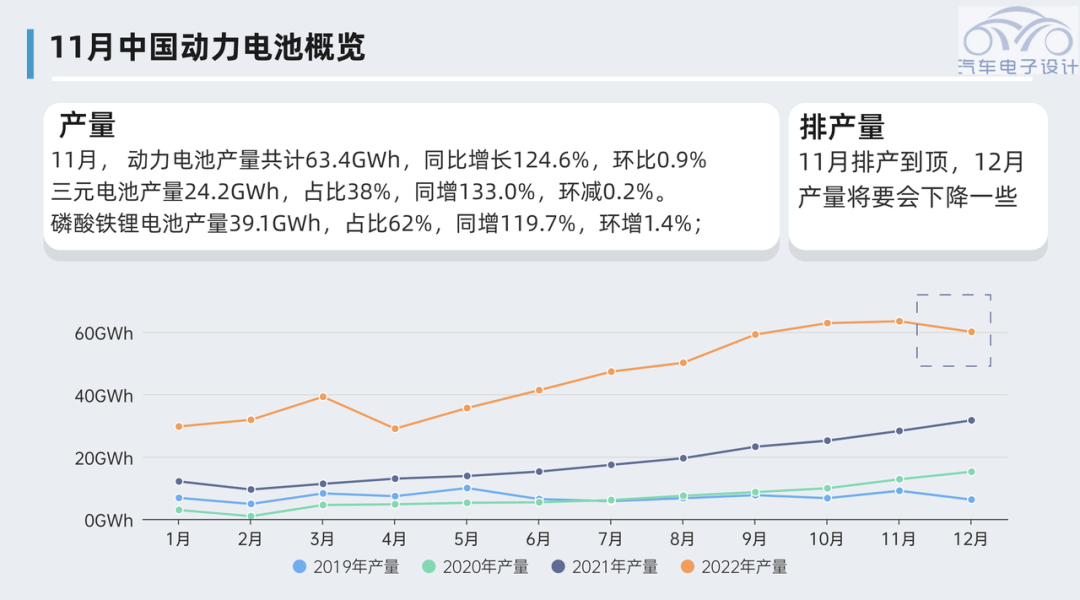
▲ Figure 8. Battery production data
● Power battery loading
In November, the installed capacity of power batteries in my country was 34.3GWh, a year-on-year increase of 64.5% and a chain increase of 12.2%. Among them, the installed capacity of lithium iron phosphate batteries was 23.1GWh, accounting for 67.4% of the total installed capacity, an increase of 99.5% year-on-year, and a ring increase of 17.4%; the installed capacity of ternary batteries was 11.0 GWh, accounting for 32.2% of the total installed capacity, an increase of 19.5% year-on-year. An increase of 2.0%. In November, my country’s power battery exports totaled 22.6GWh. This figure is really high, almost comparable to domestic consumption. The export volume of lithium iron phosphate batteries is 16.8GWh; the export volume of ternary batteries is 5.7GWh.
Due to the downhill next year, there may be some vehicles this year, which will be billed first and then transferred, because there will be a price increase (tell you to increase the price by 3000-8000) , this kind of operation will inevitably exist. There will be some vehicle inventories in the future. Due to objective reasons at the end of 2022, there will be elements of disorder in data analysis.
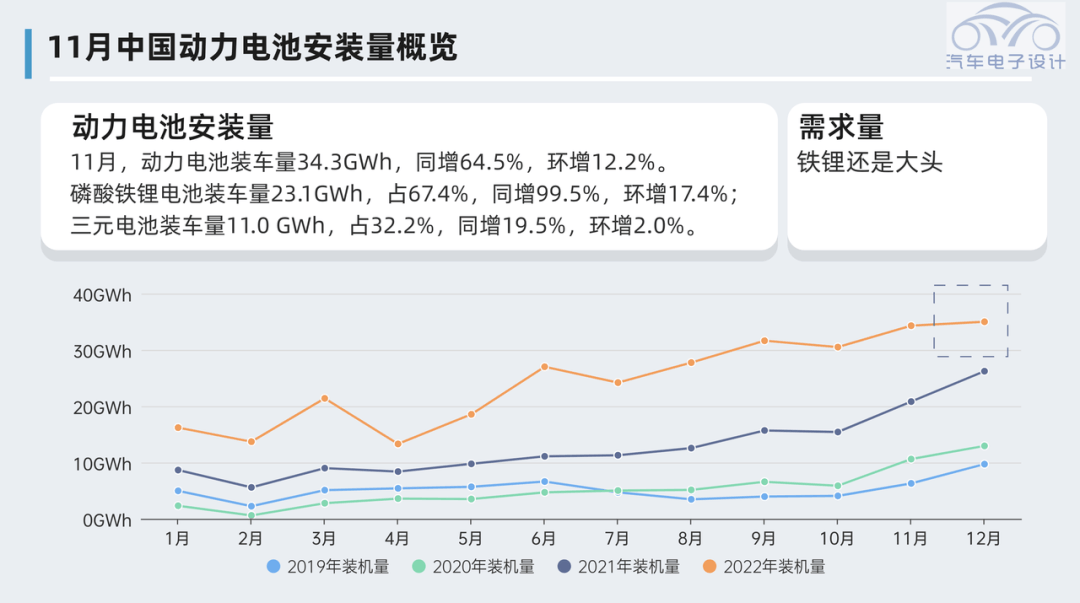
▲ Figure 9. The trend of power battery loading
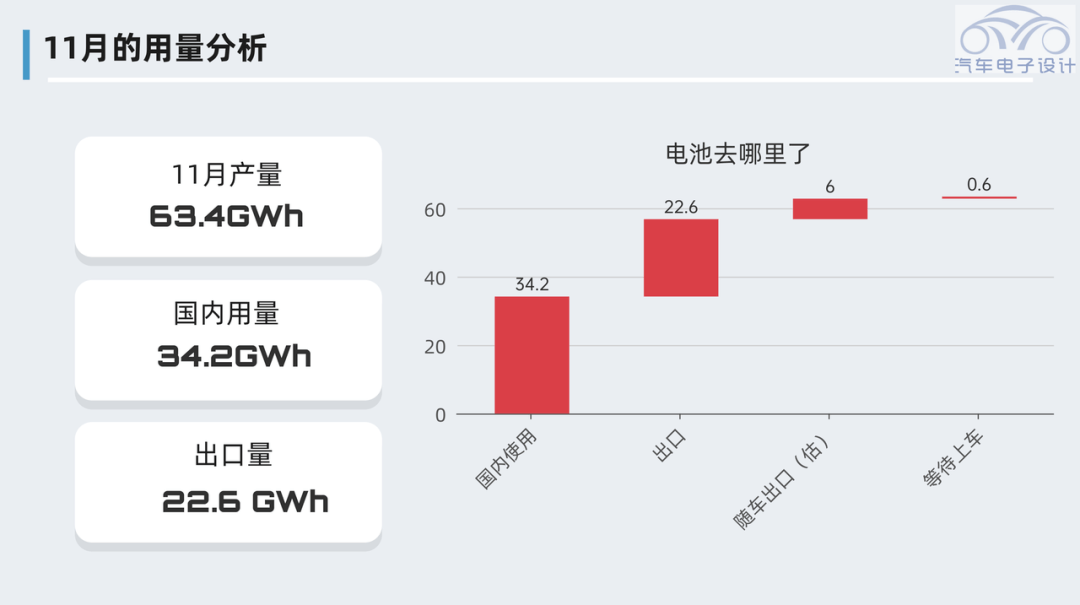
▲ Figure 10. Battery usage
● Power battery export and domestic usage
From January to November, the cumulative installed capacity of power batteries in my country was 258.5GWh, a cumulative year-on-year increase of 101.5%. The cumulative installed capacity of lithium iron phosphate batteries was 159.1GWh, accounting for 61.5% of the total installed capacity, with a cumulative increase of 145.5%; the cumulative installed capacity of ternary batteries was 99.0GWh, accounting for 38.3% of the total installed capacity, with a cumulative increase of 56.5%.
From the perspective of total battery consumption, the domestic consumption is 258.5GWh, and the total volume of vehicle-mounted exports and direct exports is almost 160GWh. This figure really reflects the competitiveness of China’s power battery industry. This also objectively proves that if Europe and the United States do not implement the policy of origin, then their pure electric vehicle industry will be realized around the export of batteries from China (European and American cars + Chinese core) .
Thinking about it objectively, this situation is difficult to sustain.
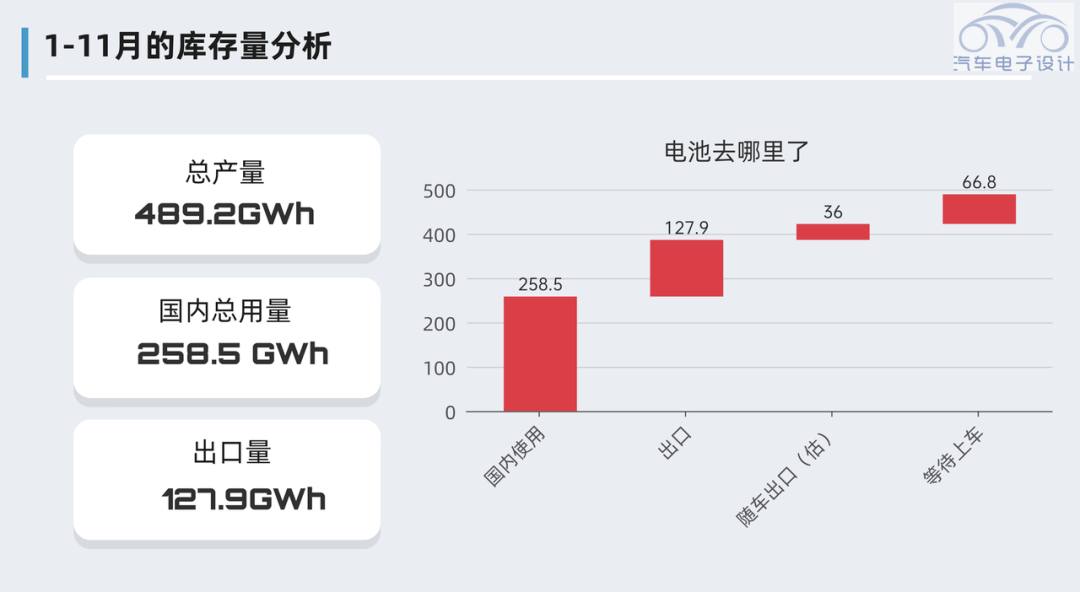
▲ Figure 11. Comprehensive analysis of batteries
Summary: From my personal point of view, the demand for Q1 data in 2023 will be relatively bleak due to social reasons. Coupled with artificial adjustments, the gap between the chain and the year-on-year ratio will be relatively large, which is to be expected. There is a high probability that 2023 will also be unilateral, and it will start to recover from Q2 with the return of China’s economic vitality-this is the rhythm of my judgment.
Post time: Dec-14-2022